> ## Documentation Index
> Fetch the complete documentation index at: https://docs.getlimelight.io/llms.txt
> Use this file to discover all available pages before exploring further.
# Render Tracking
> Find unnecessary re-renders without any configuration. No context wrappers, no Babel plugins, no Metro config.
Limelight automatically tracks every React component render in your app—with zero configuration required.
No context wrappers. No Babel plugins. No Metro config. Just add
`Limelight.connect()` and start finding performance issues.
## How It Works
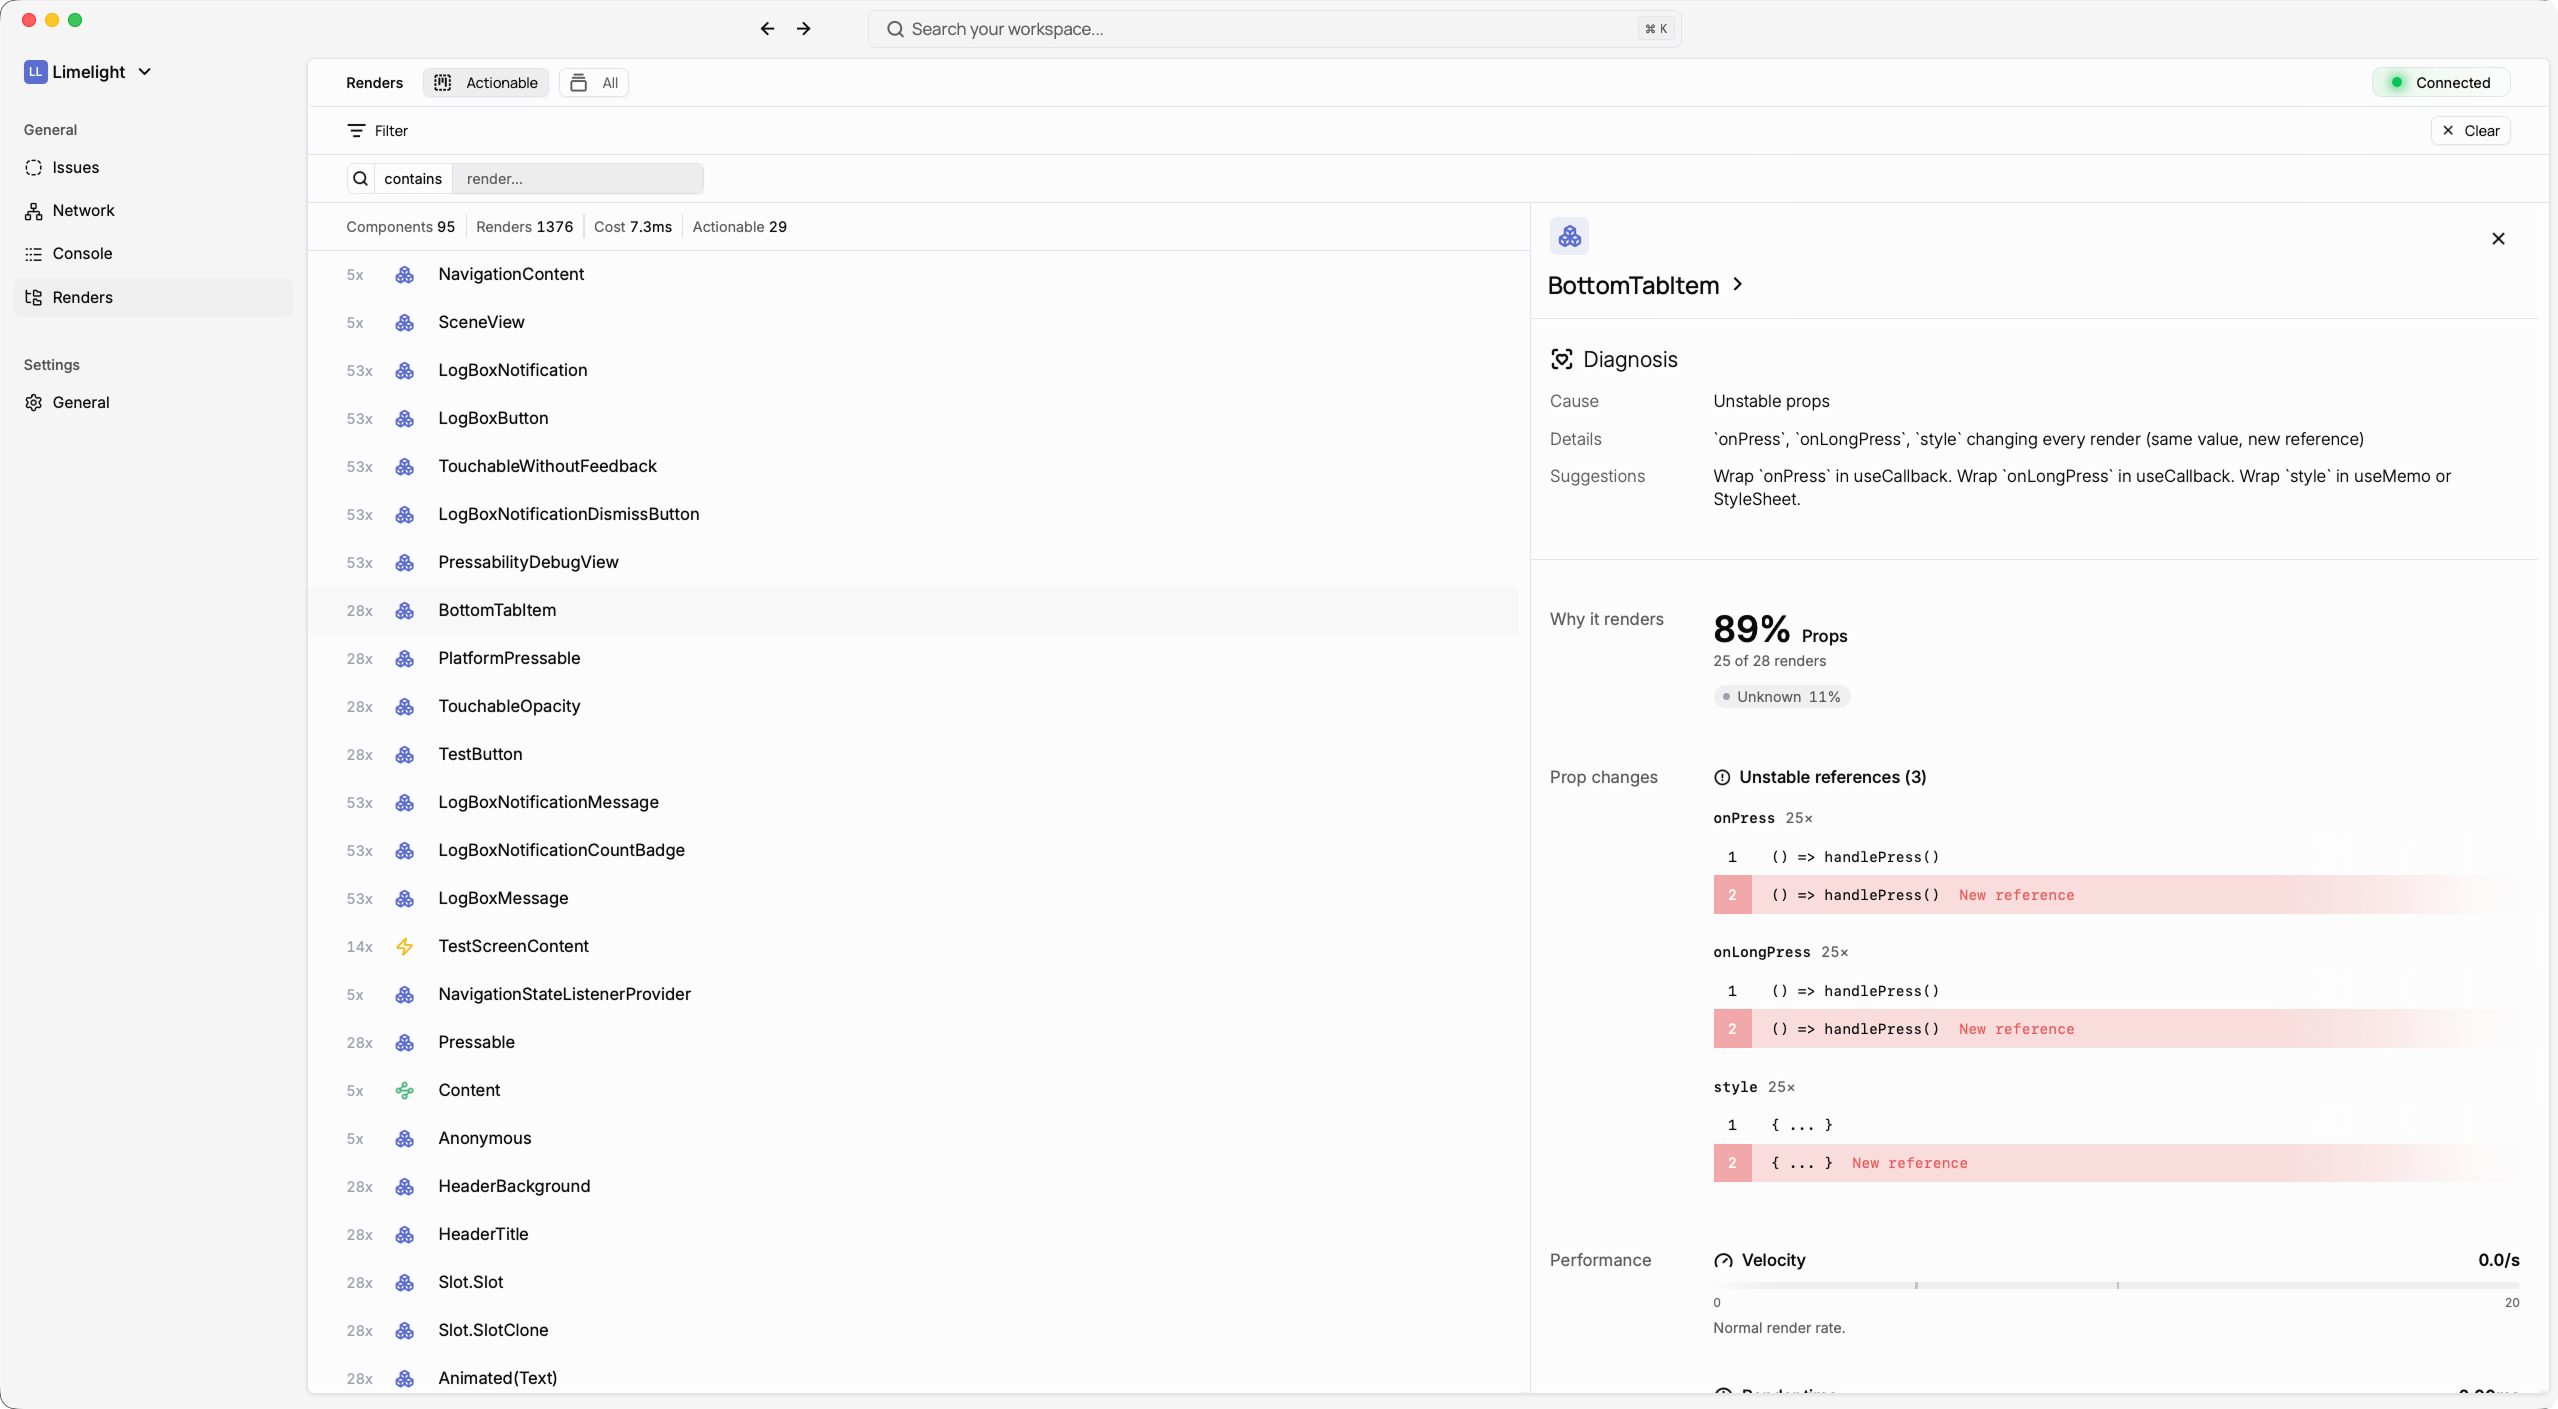
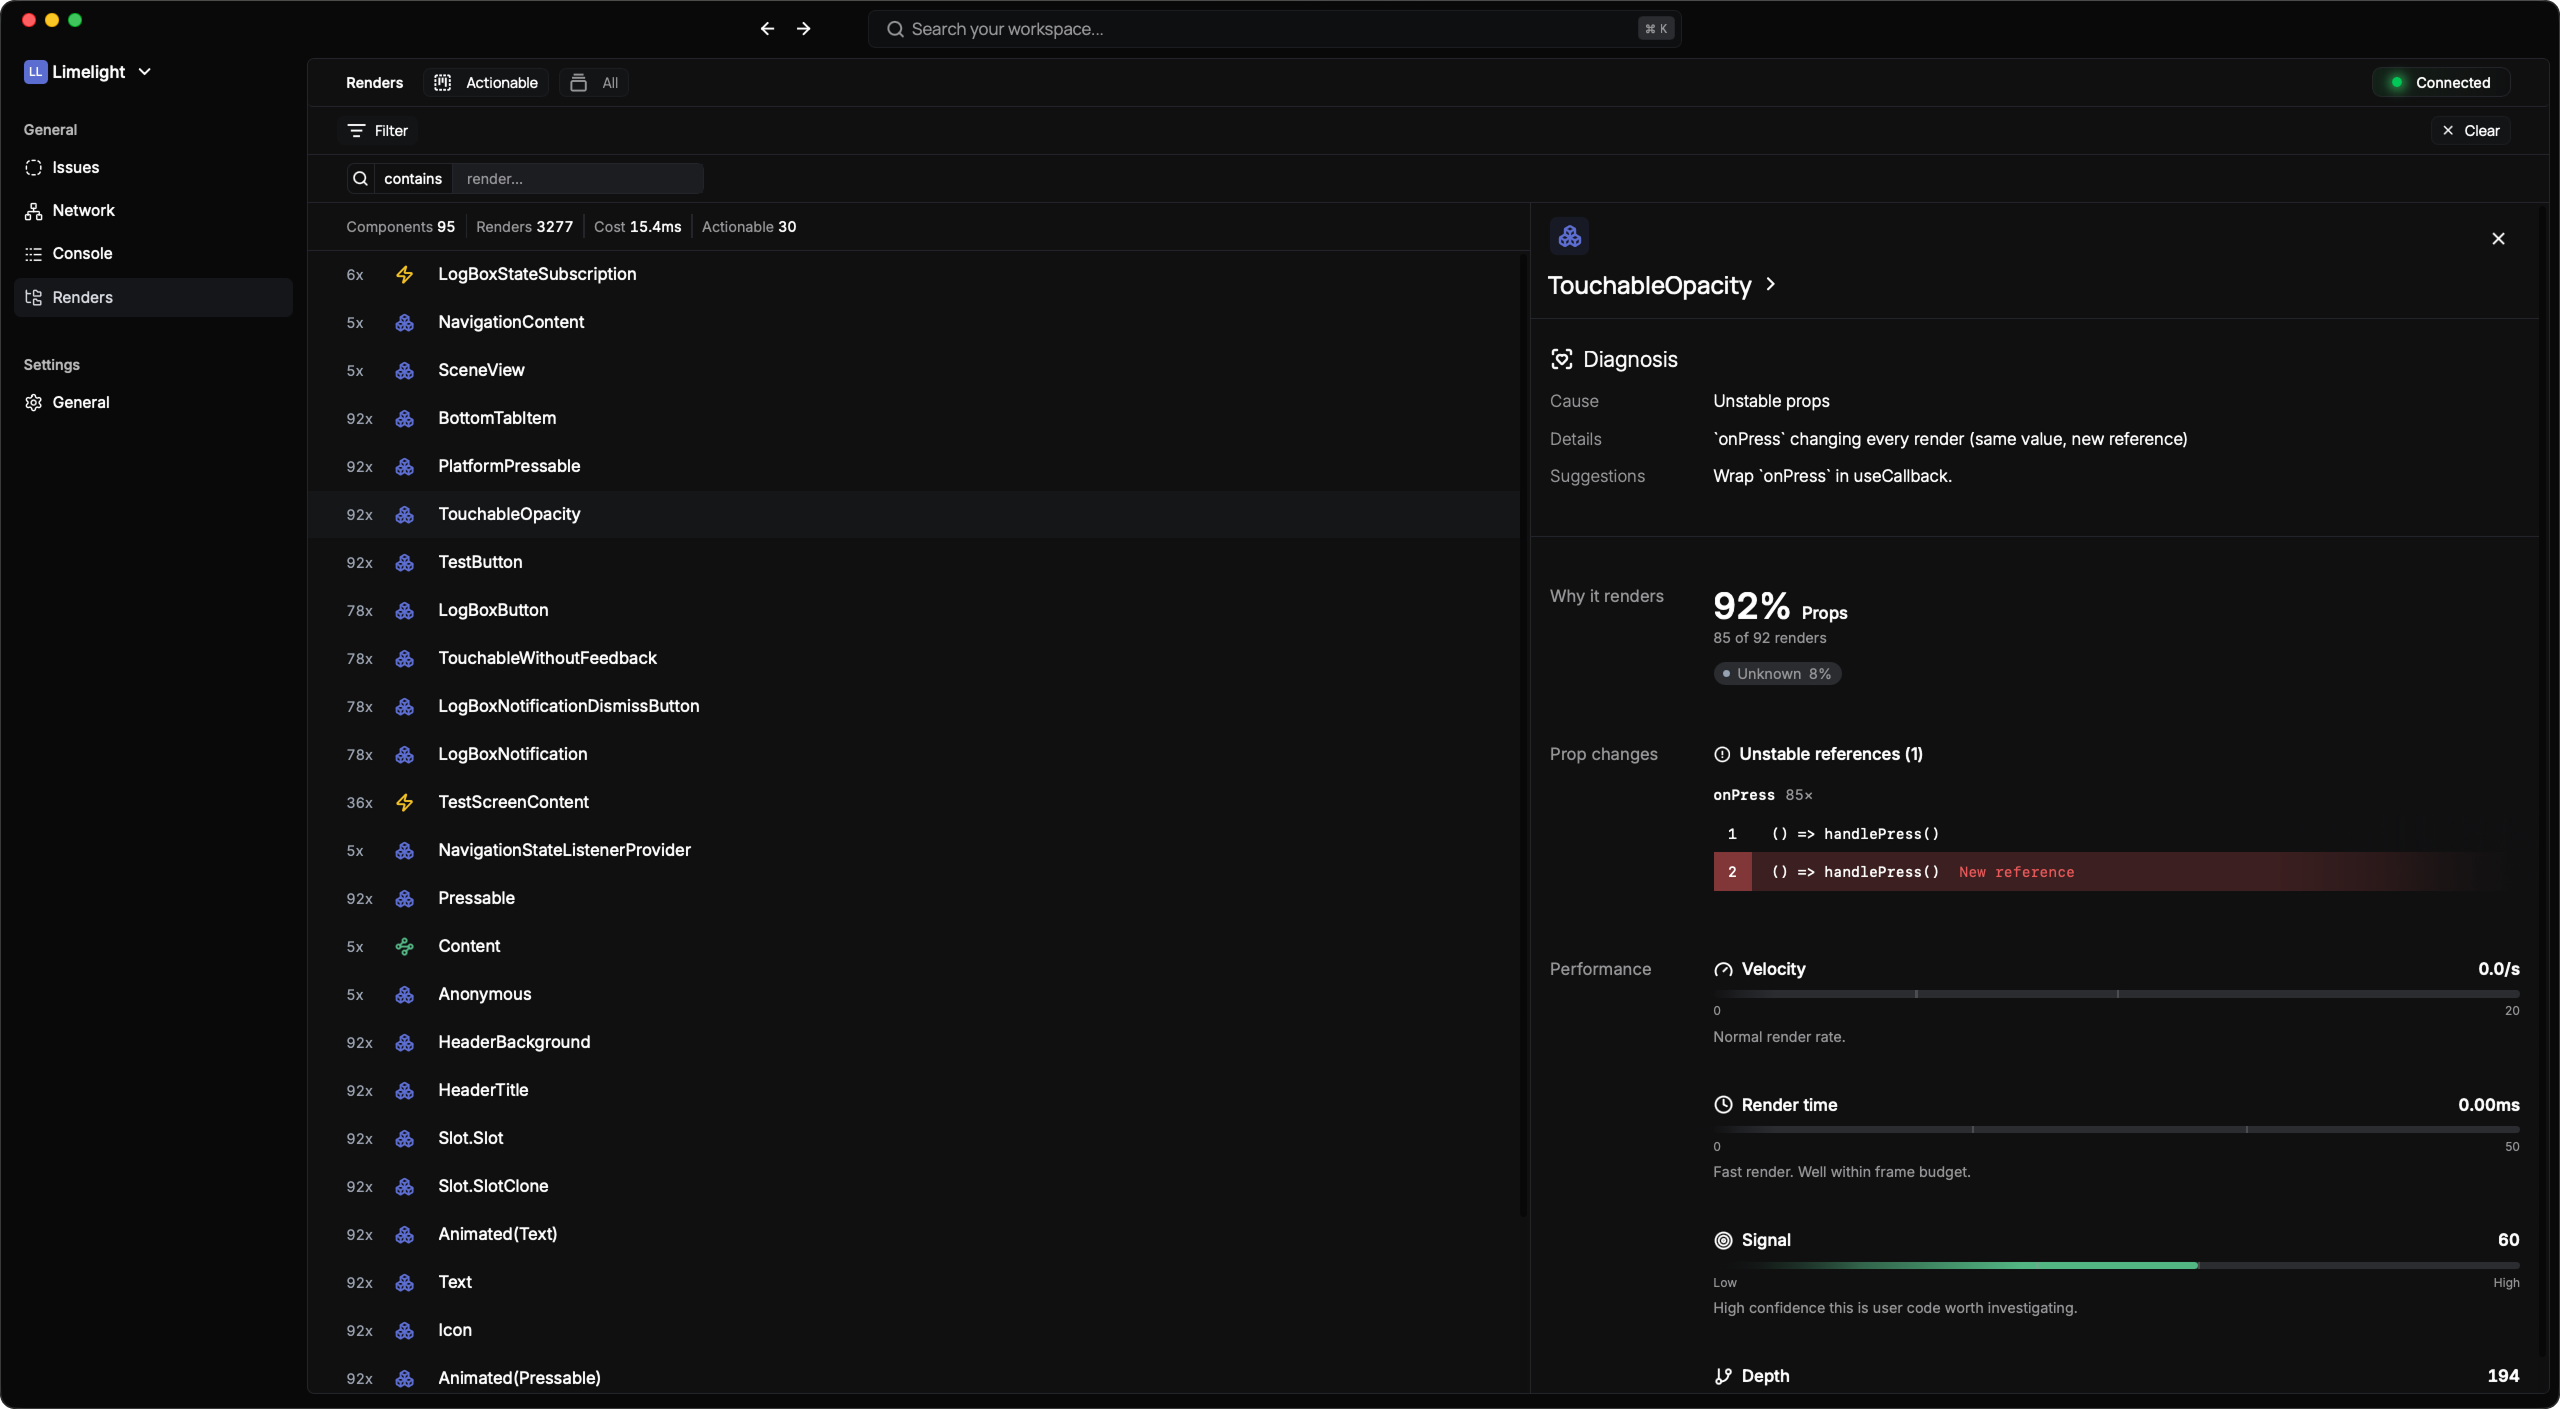 ### React Fiber Tree Walking
Unlike other render tracking tools that require you to:
* ❌ Wrap your app in a context provider
* ❌ Add Babel plugins to your build pipeline
* ❌ Configure Metro bundler
* ❌ Instrument individual components
**Limelight just works.** Here's how:
1. **Automatic Fiber Tree Detection** - Limelight hooks into React's internal Fiber tree
2. **Real-time Monitoring** - Tracks every component render as it happens
3. **Zero Runtime Overhead** - Minimal performance impact on your app
4. **No Code Changes** - Your components stay untouched
```tsx theme={null}
import { Limelight } from "@getlimelight/sdk";
Limelight.connect();
```
That's it. Every render is now tracked.
***
## Intelligent Render Analysis
Limelight doesn't just capture renders—it helps you **find the problematic ones**.
### Automatic Ranking Algorithm
Every render is scored based on:
**Frequency Metrics:**
* How often the component re-renders
* Re-render rate over time
* Clustering of rapid re-renders
**Impact Metrics:**
* Component tree depth
* Number of child components affected
* Render duration (when available)
**Pattern Detection:**
* Renders triggered by parent updates
* Props changes that don't affect output
* State updates with identical values
### Render Severity Levels
Excessive re-renders likely causing performance issues
More frequent than typical—worth investigating
Expected re-renders that are part of normal app flow
***
## Smart Grouping
Instead of showing you hundreds of individual renders, Limelight groups them intelligently:
### By Component
See all renders for a specific component grouped together:
```
UserProfile
├─ 47 renders in last 30s
├─ Ranked: 🔴 Problematic
└─ Triggered by: props.user changed 2 times, parent re-rendered 45 times
```
### By Render Cause
Understand what's triggering re-renders:
* **Props Changed** - Which props are changing and causing renders
* **State Updated** - Local state changes
* **Parent Re-rendered** - Unnecessary renders from parent updates
* **Context Changed** - Context value updates
* **Force Update** - Explicit force updates
### By Time Period
Focus on specific moments:
* Group renders that happened within the same 100ms window
* Identify render storms (multiple components re-rendering simultaneously)
* Spot cascading re-renders through your component tree
***
## What You'll See
### Render Timeline
Visual timeline showing:
* **When renders occurred** - Precise timestamps
* **Which components rendered** - Component name and path
* **Render clusters** - Groups of related renders
* **Performance markers** - Slow renders highlighted
### Render Details
Click any render to see:
* **Exact timestamp** - When it happened
* **Trigger source** - What caused it (props, state, parent, context)
* **Props diff** - What props changed (if any)
* **Component location** - File and line number
* **Child renders** - How many children re-rendered as a result
***
## Finding Performance Issues
### Common Problems Limelight Catches
**1. Unnecessary Parent Re-renders**
```tsx theme={null}
// Problem: UserList re-renders every time, causing all UserCards to re-render
function UserList({ users, selectedId }) {
return users.map((user) => (
));
}
```
**What Limelight shows:**
* 🔴 UserCard rendered 50+ times
* Cause: Parent re-rendered 50 times
* Recommendation: Wrap UserCard in React.memo()
**2. Object/Array Props Created Inline**
```tsx theme={null}
// Problem: New object created on every render
```
**What Limelight shows:**
* 🟡 UserProfile re-rendering frequently
* Cause: props.style changed (even though values are the same)
* Recommendation: Move style object outside component or use useMemo
**3. Context Re-render Storms**
```tsx theme={null}
// Problem: Context value changes cause entire tree to re-render
{/* 100+ components here all re-render when context changes */}
```
**What Limelight shows:**
* 🔴 120 components re-rendered simultaneously
* Cause: UserContext changed
* Recommendation: Split context into smaller, focused contexts
**4. State Updates with Same Value**
```tsx theme={null}
// Problem: Setting state to the same value still triggers re-render
const [count, setCount] = useState(0);
setCount(0); // Still triggers render even though value didn't change
```
**What Limelight shows:**
* 🟡 Component re-rendering but state value unchanged
* Recommendation: Add condition before setState or use useRef for tracking
***
## Render Tracking Filters
Focus on what matters:
### Filter by Severity
* Show only 🔴 Problematic renders
* Hide 🟢 Normal renders to reduce noise
### Filter by Component
* Search for specific component names
* View all renders for a particular component
### Filter by Time Range
* Focus on a specific time period
* Investigate performance issues during specific user actions
### Filter by Render Count
* Show only components with > X renders
* Find the highest re-rendering components
***
## Actionable Recommendations
Limelight doesn't just show problems—it tells you how to fix them:
### For High Parent Re-renders
```tsx theme={null}
// ❌ Before
;
// ✅ After: Use React.memo
const UserCard = React.memo(({ user, selected }) => {
// Component only re-renders when user or selected actually change
});
```
### For Inline Object Props
```tsx theme={null}
// ❌ Before
;
// ✅ After: Define outside component
const componentStyle = { margin: 10 };
;
// Or use useMemo for dynamic values
const style = useMemo(() => ({ margin: spacing }), [spacing]);
;
```
### For Context Issues
```tsx theme={null}
// ❌ Before: Everything re-renders on any context change
// ✅ After: Split contexts
```
### For Unnecessary State Updates
```tsx theme={null}
// ❌ Before
setCount(newValue);
// ✅ After: Check before setting
if (newValue !== count) {
setCount(newValue);
}
// Or use functional update to avoid dependency
setCount((prev) => (prev === newValue ? prev : newValue));
```
***
## How Limelight Compares
### vs. React DevTools Profiler
| Feature | Limelight | React DevTools Profiler |
| -------------------------- | ---------------- | ---------------------------- |
| Setup Required | ✅ Zero config | ⚠️ Manual profiling sessions |
| Real-time Tracking | ✅ Always on | ❌ Must start/stop recording |
| Automatic Ranking | ✅ Built-in | ❌ Manual analysis |
| Render Grouping | ✅ Smart grouping | ⚠️ Flame graph only |
| Actionable Recommendations | ✅ Yes | ❌ No |
| Remote Debugging | ✅ Yes | ⚠️ USB only |
### vs. Why Did You Render
| Feature | Limelight | Why Did You Render |
| -------------------- | ------------- | -------------------------------------- |
| Configuration | ✅ Zero config | ❌ Babel plugin + whyDidYouRender setup |
| Performance Impact | ✅ Minimal | ⚠️ Can slow dev mode |
| Component Wrapping | ✅ Not needed | ❌ Must annotate components |
| Visual Timeline | ✅ Yes | ❌ Console logs only |
| Severity Ranking | ✅ Automatic | ❌ Manual interpretation |
| React Native Support | ✅ Native | ⚠️ Limited |
### vs. React Native Performance Monitor
| Feature | Limelight | RN Perf Monitor |
| ------------------------ | ----------- | ---------------------- |
| Component-Level Tracking | ✅ Yes | ❌ Frame rate only |
| Render Cause Detection | ✅ Automatic | ❌ No |
| Grouping & Filtering | ✅ Advanced | ❌ No |
| Issue Detection | ✅ Automatic | ❌ Manual |
| Setup Complexity | ✅ One line | ✅ Built-in but limited |
***
## Performance Considerations
### Minimal Overhead
Limelight's render tracking is designed to be lightweight:
* **No Babel transformations** - Zero build-time overhead
* **No component wrapping** - No extra React elements
* **Efficient fiber traversal** - Optimized tree walking
* **Smart batching** - Groups updates to minimize WebSocket traffic
* **Lazy serialization** - Only serializes data when you view it
### Development Only
Render tracking is automatically disabled in production:
```tsx theme={null}
Limelight.connect({
enabled: __DEV__, // Only tracks renders in dev mode
});
```
This ensures **zero performance impact** on your production app.
***
## Getting Started
### 1. Install the SDK
```bash theme={null}
npm install @getlimelight/sdk
```
### 2. Add One Line
```tsx theme={null}
import { Limelight } from "@getlimelight/sdk";
Limelight.connect();
```
### 3. Start Debugging
Open Limelight (desktop app or hosted dashboard) and navigate to the **Renders** tab.
That's it. Every render is now tracked, ranked, and ready to investigate.
***
## Real-World Example
### Before Limelight
Your app feels sluggish. You know there are performance issues but:
* Where do you start?
* Which components are the problem?
* You'd need to wrap components, add profiling, analyze flame graphs...
### After Limelight
1. Open Limelight
2. Sort by "Most Problematic"
3. See: `ProductCard` rendered 847 times in 30 seconds 🔴
4. Click to investigate: "Parent re-rendered 845 times"
5. Recommendation: "Wrap in React.memo()"
6. Apply the fix
7. Renders drop to 2 🟢
**5 minutes from problem discovery to fix.**
***
## Tips & Best Practices
### 1. Start with High Severity
Focus on 🔴 Problematic renders first—these have the biggest performance impact.
### 2. Look for Patterns
If multiple components show "parent re-rendered" as the main cause, fix the parent instead of memoizing every child.
### 3. Use Time-Based Filtering
Reproduce a slow interaction, note the timestamp, then filter renders to that time period.
### 4. Check Render Clusters
Renders that happen within milliseconds of each other often indicate a single root cause.
### 5. Don't Over-Optimize
Not every re-render is bad. Limelight's ranking helps you focus on the ones that actually matter.
***
## FAQ
**Q: Does this work with React Native's new architecture?**
A: Yes! Limelight works with both the old and new React Native architectures.
**Q: Will this slow down my app?**
A: Render tracking has minimal overhead in development and is automatically disabled in production.
**Q: Do I need to change my components?**
A: Nope! No wrappers, no HOCs, no decorators. Your components stay exactly as they are.
**Q: Can I track renders in production?**
A: We don't recommend it. While technically possible, the overhead isn't worth it for production apps.
**Q: Does this work with class components?**
A: Yes! Limelight tracks both functional and class components.
**Q: What about React.memo and useMemo?**
A: Limelight tracks renders regardless of memoization. It'll show you if your memoization is actually working.
***
**Zero config. Zero overhead. Zero excuses for slow apps.**
Start tracking renders with Limelight today.
### React Fiber Tree Walking
Unlike other render tracking tools that require you to:
* ❌ Wrap your app in a context provider
* ❌ Add Babel plugins to your build pipeline
* ❌ Configure Metro bundler
* ❌ Instrument individual components
**Limelight just works.** Here's how:
1. **Automatic Fiber Tree Detection** - Limelight hooks into React's internal Fiber tree
2. **Real-time Monitoring** - Tracks every component render as it happens
3. **Zero Runtime Overhead** - Minimal performance impact on your app
4. **No Code Changes** - Your components stay untouched
```tsx theme={null}
import { Limelight } from "@getlimelight/sdk";
Limelight.connect();
```
That's it. Every render is now tracked.
***
## Intelligent Render Analysis
Limelight doesn't just capture renders—it helps you **find the problematic ones**.
### Automatic Ranking Algorithm
Every render is scored based on:
**Frequency Metrics:**
* How often the component re-renders
* Re-render rate over time
* Clustering of rapid re-renders
**Impact Metrics:**
* Component tree depth
* Number of child components affected
* Render duration (when available)
**Pattern Detection:**
* Renders triggered by parent updates
* Props changes that don't affect output
* State updates with identical values
### Render Severity Levels
Excessive re-renders likely causing performance issues
More frequent than typical—worth investigating
Expected re-renders that are part of normal app flow
***
## Smart Grouping
Instead of showing you hundreds of individual renders, Limelight groups them intelligently:
### By Component
See all renders for a specific component grouped together:
```
UserProfile
├─ 47 renders in last 30s
├─ Ranked: 🔴 Problematic
└─ Triggered by: props.user changed 2 times, parent re-rendered 45 times
```
### By Render Cause
Understand what's triggering re-renders:
* **Props Changed** - Which props are changing and causing renders
* **State Updated** - Local state changes
* **Parent Re-rendered** - Unnecessary renders from parent updates
* **Context Changed** - Context value updates
* **Force Update** - Explicit force updates
### By Time Period
Focus on specific moments:
* Group renders that happened within the same 100ms window
* Identify render storms (multiple components re-rendering simultaneously)
* Spot cascading re-renders through your component tree
***
## What You'll See
### Render Timeline
Visual timeline showing:
* **When renders occurred** - Precise timestamps
* **Which components rendered** - Component name and path
* **Render clusters** - Groups of related renders
* **Performance markers** - Slow renders highlighted
### Render Details
Click any render to see:
* **Exact timestamp** - When it happened
* **Trigger source** - What caused it (props, state, parent, context)
* **Props diff** - What props changed (if any)
* **Component location** - File and line number
* **Child renders** - How many children re-rendered as a result
***
## Finding Performance Issues
### Common Problems Limelight Catches
**1. Unnecessary Parent Re-renders**
```tsx theme={null}
// Problem: UserList re-renders every time, causing all UserCards to re-render
function UserList({ users, selectedId }) {
return users.map((user) => (
));
}
```
**What Limelight shows:**
* 🔴 UserCard rendered 50+ times
* Cause: Parent re-rendered 50 times
* Recommendation: Wrap UserCard in React.memo()
**2. Object/Array Props Created Inline**
```tsx theme={null}
// Problem: New object created on every render
```
**What Limelight shows:**
* 🟡 UserProfile re-rendering frequently
* Cause: props.style changed (even though values are the same)
* Recommendation: Move style object outside component or use useMemo
**3. Context Re-render Storms**
```tsx theme={null}
// Problem: Context value changes cause entire tree to re-render
{/* 100+ components here all re-render when context changes */}
```
**What Limelight shows:**
* 🔴 120 components re-rendered simultaneously
* Cause: UserContext changed
* Recommendation: Split context into smaller, focused contexts
**4. State Updates with Same Value**
```tsx theme={null}
// Problem: Setting state to the same value still triggers re-render
const [count, setCount] = useState(0);
setCount(0); // Still triggers render even though value didn't change
```
**What Limelight shows:**
* 🟡 Component re-rendering but state value unchanged
* Recommendation: Add condition before setState or use useRef for tracking
***
## Render Tracking Filters
Focus on what matters:
### Filter by Severity
* Show only 🔴 Problematic renders
* Hide 🟢 Normal renders to reduce noise
### Filter by Component
* Search for specific component names
* View all renders for a particular component
### Filter by Time Range
* Focus on a specific time period
* Investigate performance issues during specific user actions
### Filter by Render Count
* Show only components with > X renders
* Find the highest re-rendering components
***
## Actionable Recommendations
Limelight doesn't just show problems—it tells you how to fix them:
### For High Parent Re-renders
```tsx theme={null}
// ❌ Before
;
// ✅ After: Use React.memo
const UserCard = React.memo(({ user, selected }) => {
// Component only re-renders when user or selected actually change
});
```
### For Inline Object Props
```tsx theme={null}
// ❌ Before
;
// ✅ After: Define outside component
const componentStyle = { margin: 10 };
;
// Or use useMemo for dynamic values
const style = useMemo(() => ({ margin: spacing }), [spacing]);
;
```
### For Context Issues
```tsx theme={null}
// ❌ Before: Everything re-renders on any context change
// ✅ After: Split contexts
```
### For Unnecessary State Updates
```tsx theme={null}
// ❌ Before
setCount(newValue);
// ✅ After: Check before setting
if (newValue !== count) {
setCount(newValue);
}
// Or use functional update to avoid dependency
setCount((prev) => (prev === newValue ? prev : newValue));
```
***
## How Limelight Compares
### vs. React DevTools Profiler
| Feature | Limelight | React DevTools Profiler |
| -------------------------- | ---------------- | ---------------------------- |
| Setup Required | ✅ Zero config | ⚠️ Manual profiling sessions |
| Real-time Tracking | ✅ Always on | ❌ Must start/stop recording |
| Automatic Ranking | ✅ Built-in | ❌ Manual analysis |
| Render Grouping | ✅ Smart grouping | ⚠️ Flame graph only |
| Actionable Recommendations | ✅ Yes | ❌ No |
| Remote Debugging | ✅ Yes | ⚠️ USB only |
### vs. Why Did You Render
| Feature | Limelight | Why Did You Render |
| -------------------- | ------------- | -------------------------------------- |
| Configuration | ✅ Zero config | ❌ Babel plugin + whyDidYouRender setup |
| Performance Impact | ✅ Minimal | ⚠️ Can slow dev mode |
| Component Wrapping | ✅ Not needed | ❌ Must annotate components |
| Visual Timeline | ✅ Yes | ❌ Console logs only |
| Severity Ranking | ✅ Automatic | ❌ Manual interpretation |
| React Native Support | ✅ Native | ⚠️ Limited |
### vs. React Native Performance Monitor
| Feature | Limelight | RN Perf Monitor |
| ------------------------ | ----------- | ---------------------- |
| Component-Level Tracking | ✅ Yes | ❌ Frame rate only |
| Render Cause Detection | ✅ Automatic | ❌ No |
| Grouping & Filtering | ✅ Advanced | ❌ No |
| Issue Detection | ✅ Automatic | ❌ Manual |
| Setup Complexity | ✅ One line | ✅ Built-in but limited |
***
## Performance Considerations
### Minimal Overhead
Limelight's render tracking is designed to be lightweight:
* **No Babel transformations** - Zero build-time overhead
* **No component wrapping** - No extra React elements
* **Efficient fiber traversal** - Optimized tree walking
* **Smart batching** - Groups updates to minimize WebSocket traffic
* **Lazy serialization** - Only serializes data when you view it
### Development Only
Render tracking is automatically disabled in production:
```tsx theme={null}
Limelight.connect({
enabled: __DEV__, // Only tracks renders in dev mode
});
```
This ensures **zero performance impact** on your production app.
***
## Getting Started
### 1. Install the SDK
```bash theme={null}
npm install @getlimelight/sdk
```
### 2. Add One Line
```tsx theme={null}
import { Limelight } from "@getlimelight/sdk";
Limelight.connect();
```
### 3. Start Debugging
Open Limelight (desktop app or hosted dashboard) and navigate to the **Renders** tab.
That's it. Every render is now tracked, ranked, and ready to investigate.
***
## Real-World Example
### Before Limelight
Your app feels sluggish. You know there are performance issues but:
* Where do you start?
* Which components are the problem?
* You'd need to wrap components, add profiling, analyze flame graphs...
### After Limelight
1. Open Limelight
2. Sort by "Most Problematic"
3. See: `ProductCard` rendered 847 times in 30 seconds 🔴
4. Click to investigate: "Parent re-rendered 845 times"
5. Recommendation: "Wrap in React.memo()"
6. Apply the fix
7. Renders drop to 2 🟢
**5 minutes from problem discovery to fix.**
***
## Tips & Best Practices
### 1. Start with High Severity
Focus on 🔴 Problematic renders first—these have the biggest performance impact.
### 2. Look for Patterns
If multiple components show "parent re-rendered" as the main cause, fix the parent instead of memoizing every child.
### 3. Use Time-Based Filtering
Reproduce a slow interaction, note the timestamp, then filter renders to that time period.
### 4. Check Render Clusters
Renders that happen within milliseconds of each other often indicate a single root cause.
### 5. Don't Over-Optimize
Not every re-render is bad. Limelight's ranking helps you focus on the ones that actually matter.
***
## FAQ
**Q: Does this work with React Native's new architecture?**
A: Yes! Limelight works with both the old and new React Native architectures.
**Q: Will this slow down my app?**
A: Render tracking has minimal overhead in development and is automatically disabled in production.
**Q: Do I need to change my components?**
A: Nope! No wrappers, no HOCs, no decorators. Your components stay exactly as they are.
**Q: Can I track renders in production?**
A: We don't recommend it. While technically possible, the overhead isn't worth it for production apps.
**Q: Does this work with class components?**
A: Yes! Limelight tracks both functional and class components.
**Q: What about React.memo and useMemo?**
A: Limelight tracks renders regardless of memoization. It'll show you if your memoization is actually working.
***
**Zero config. Zero overhead. Zero excuses for slow apps.**
Start tracking renders with Limelight today.