> ## Documentation Index
> Fetch the complete documentation index at: https://docs.getlimelight.io/llms.txt
> Use this file to discover all available pages before exploring further.
# Network requests
### Visual Request Timeline
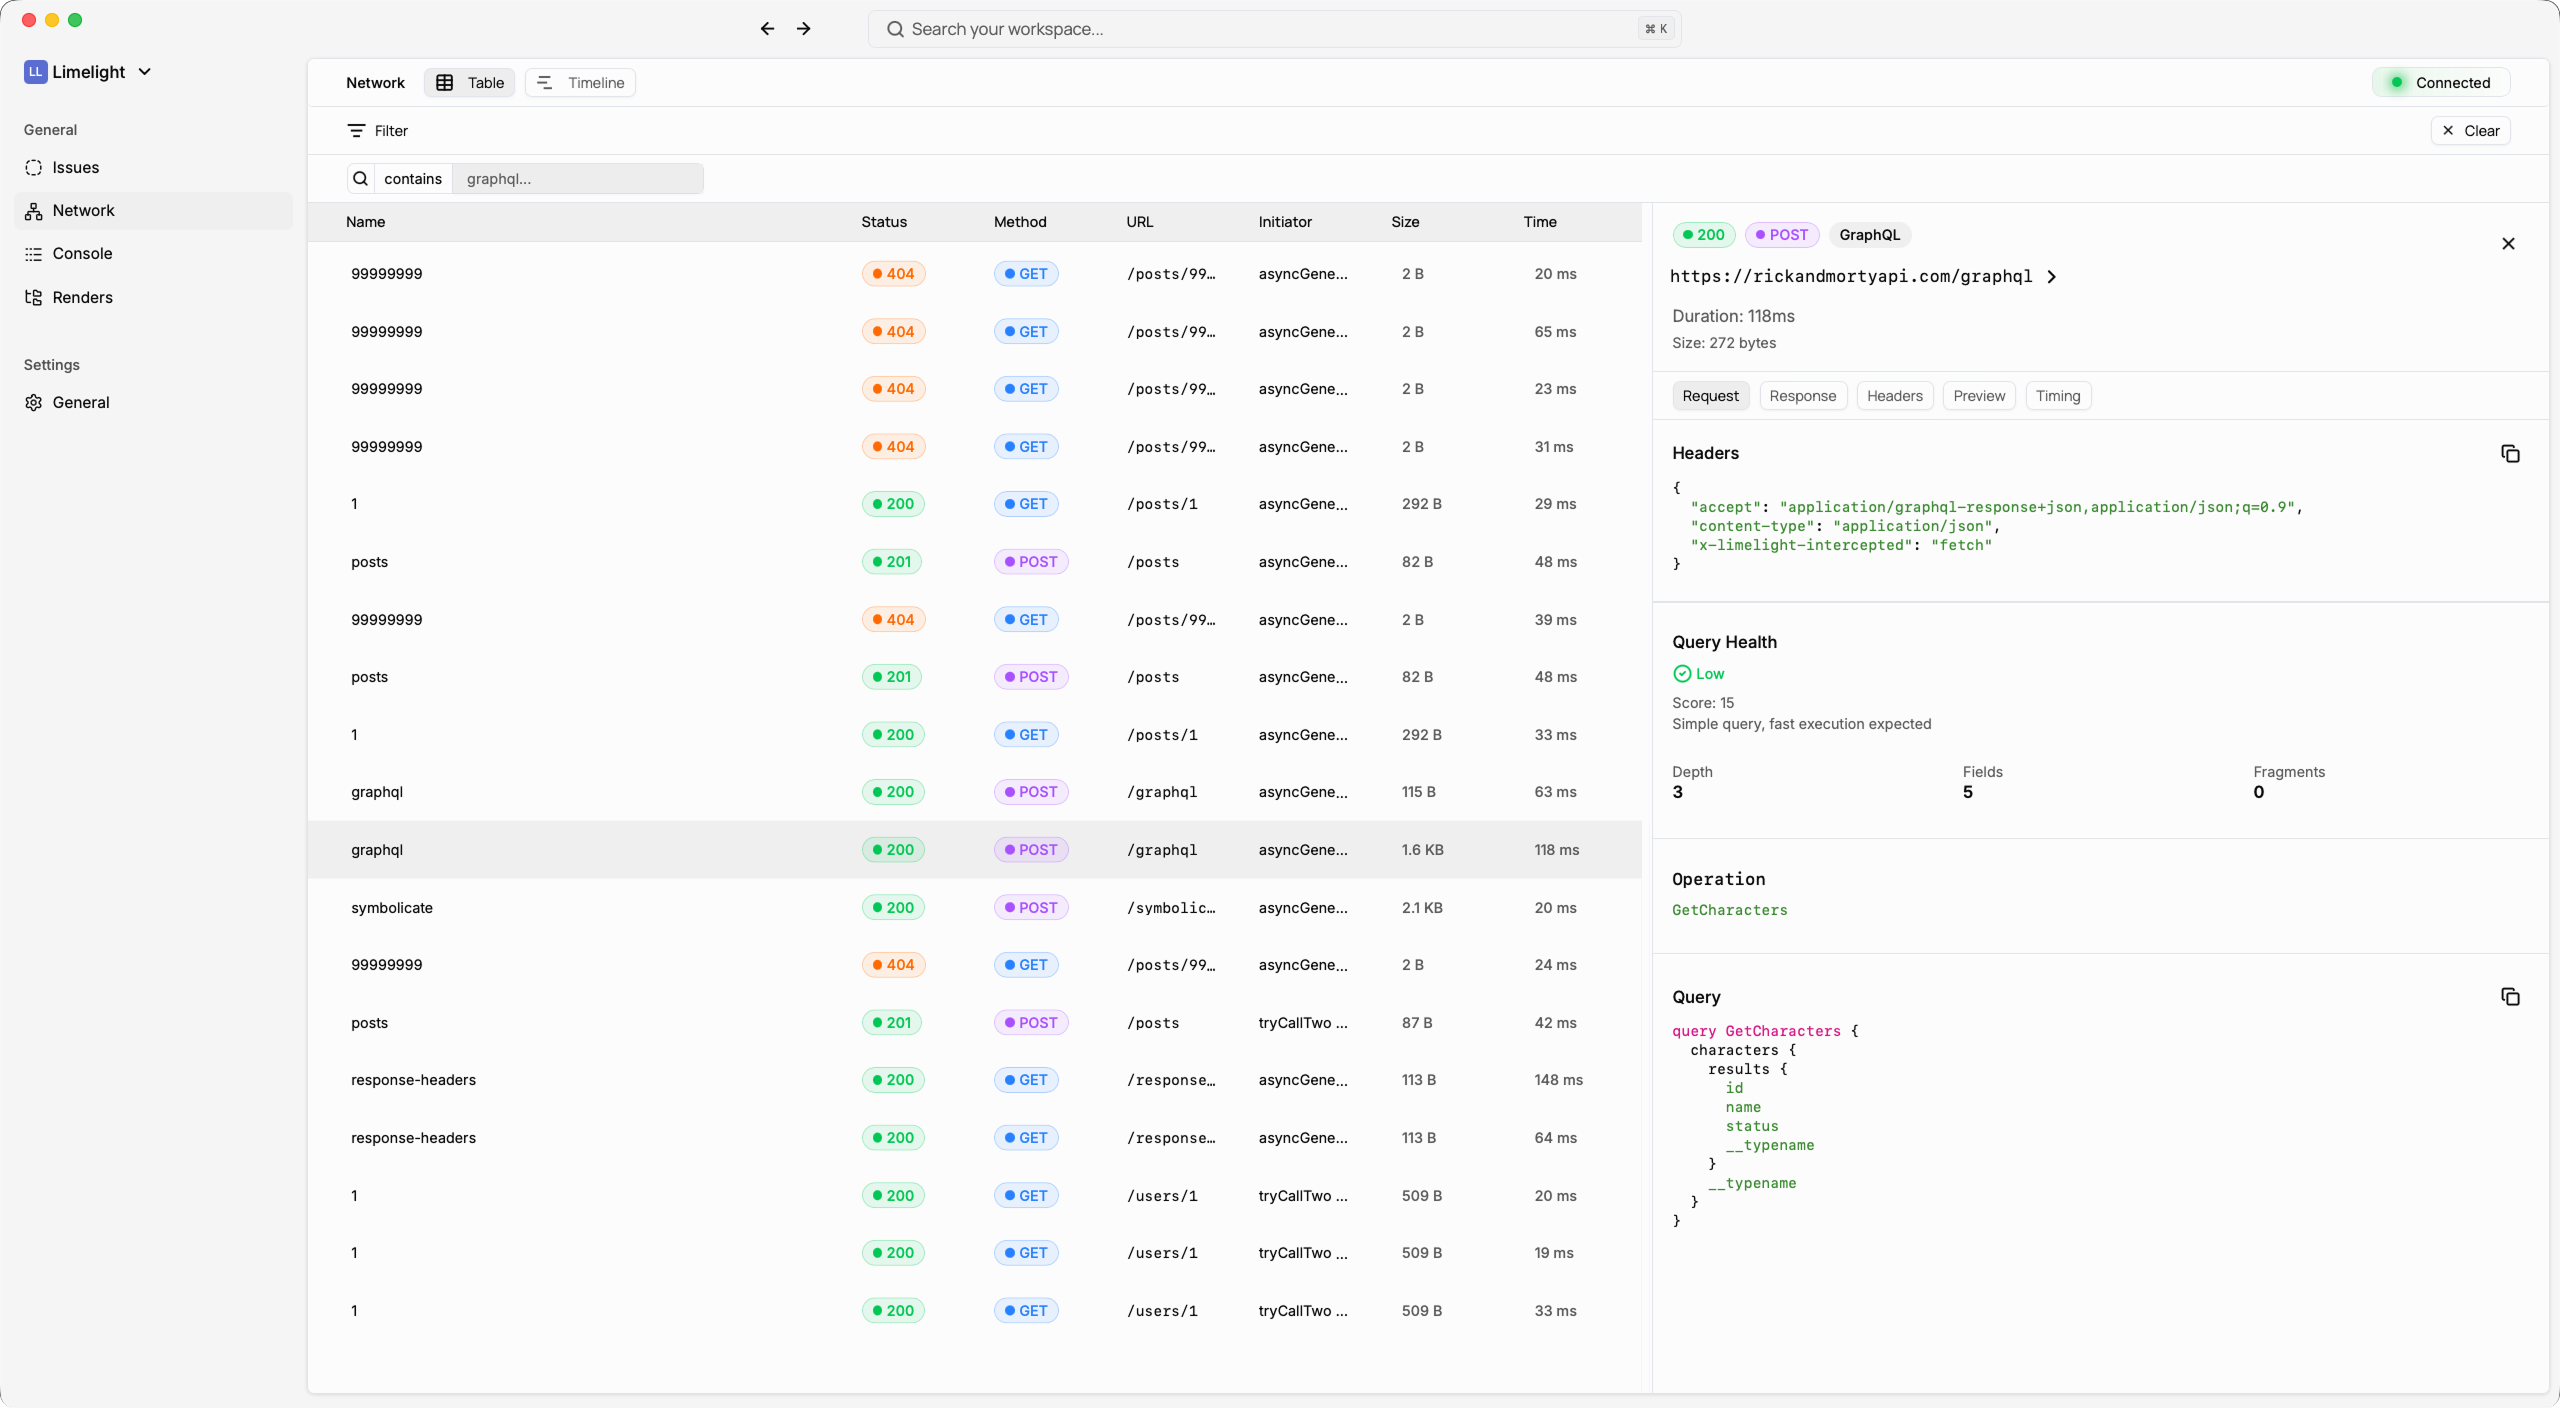
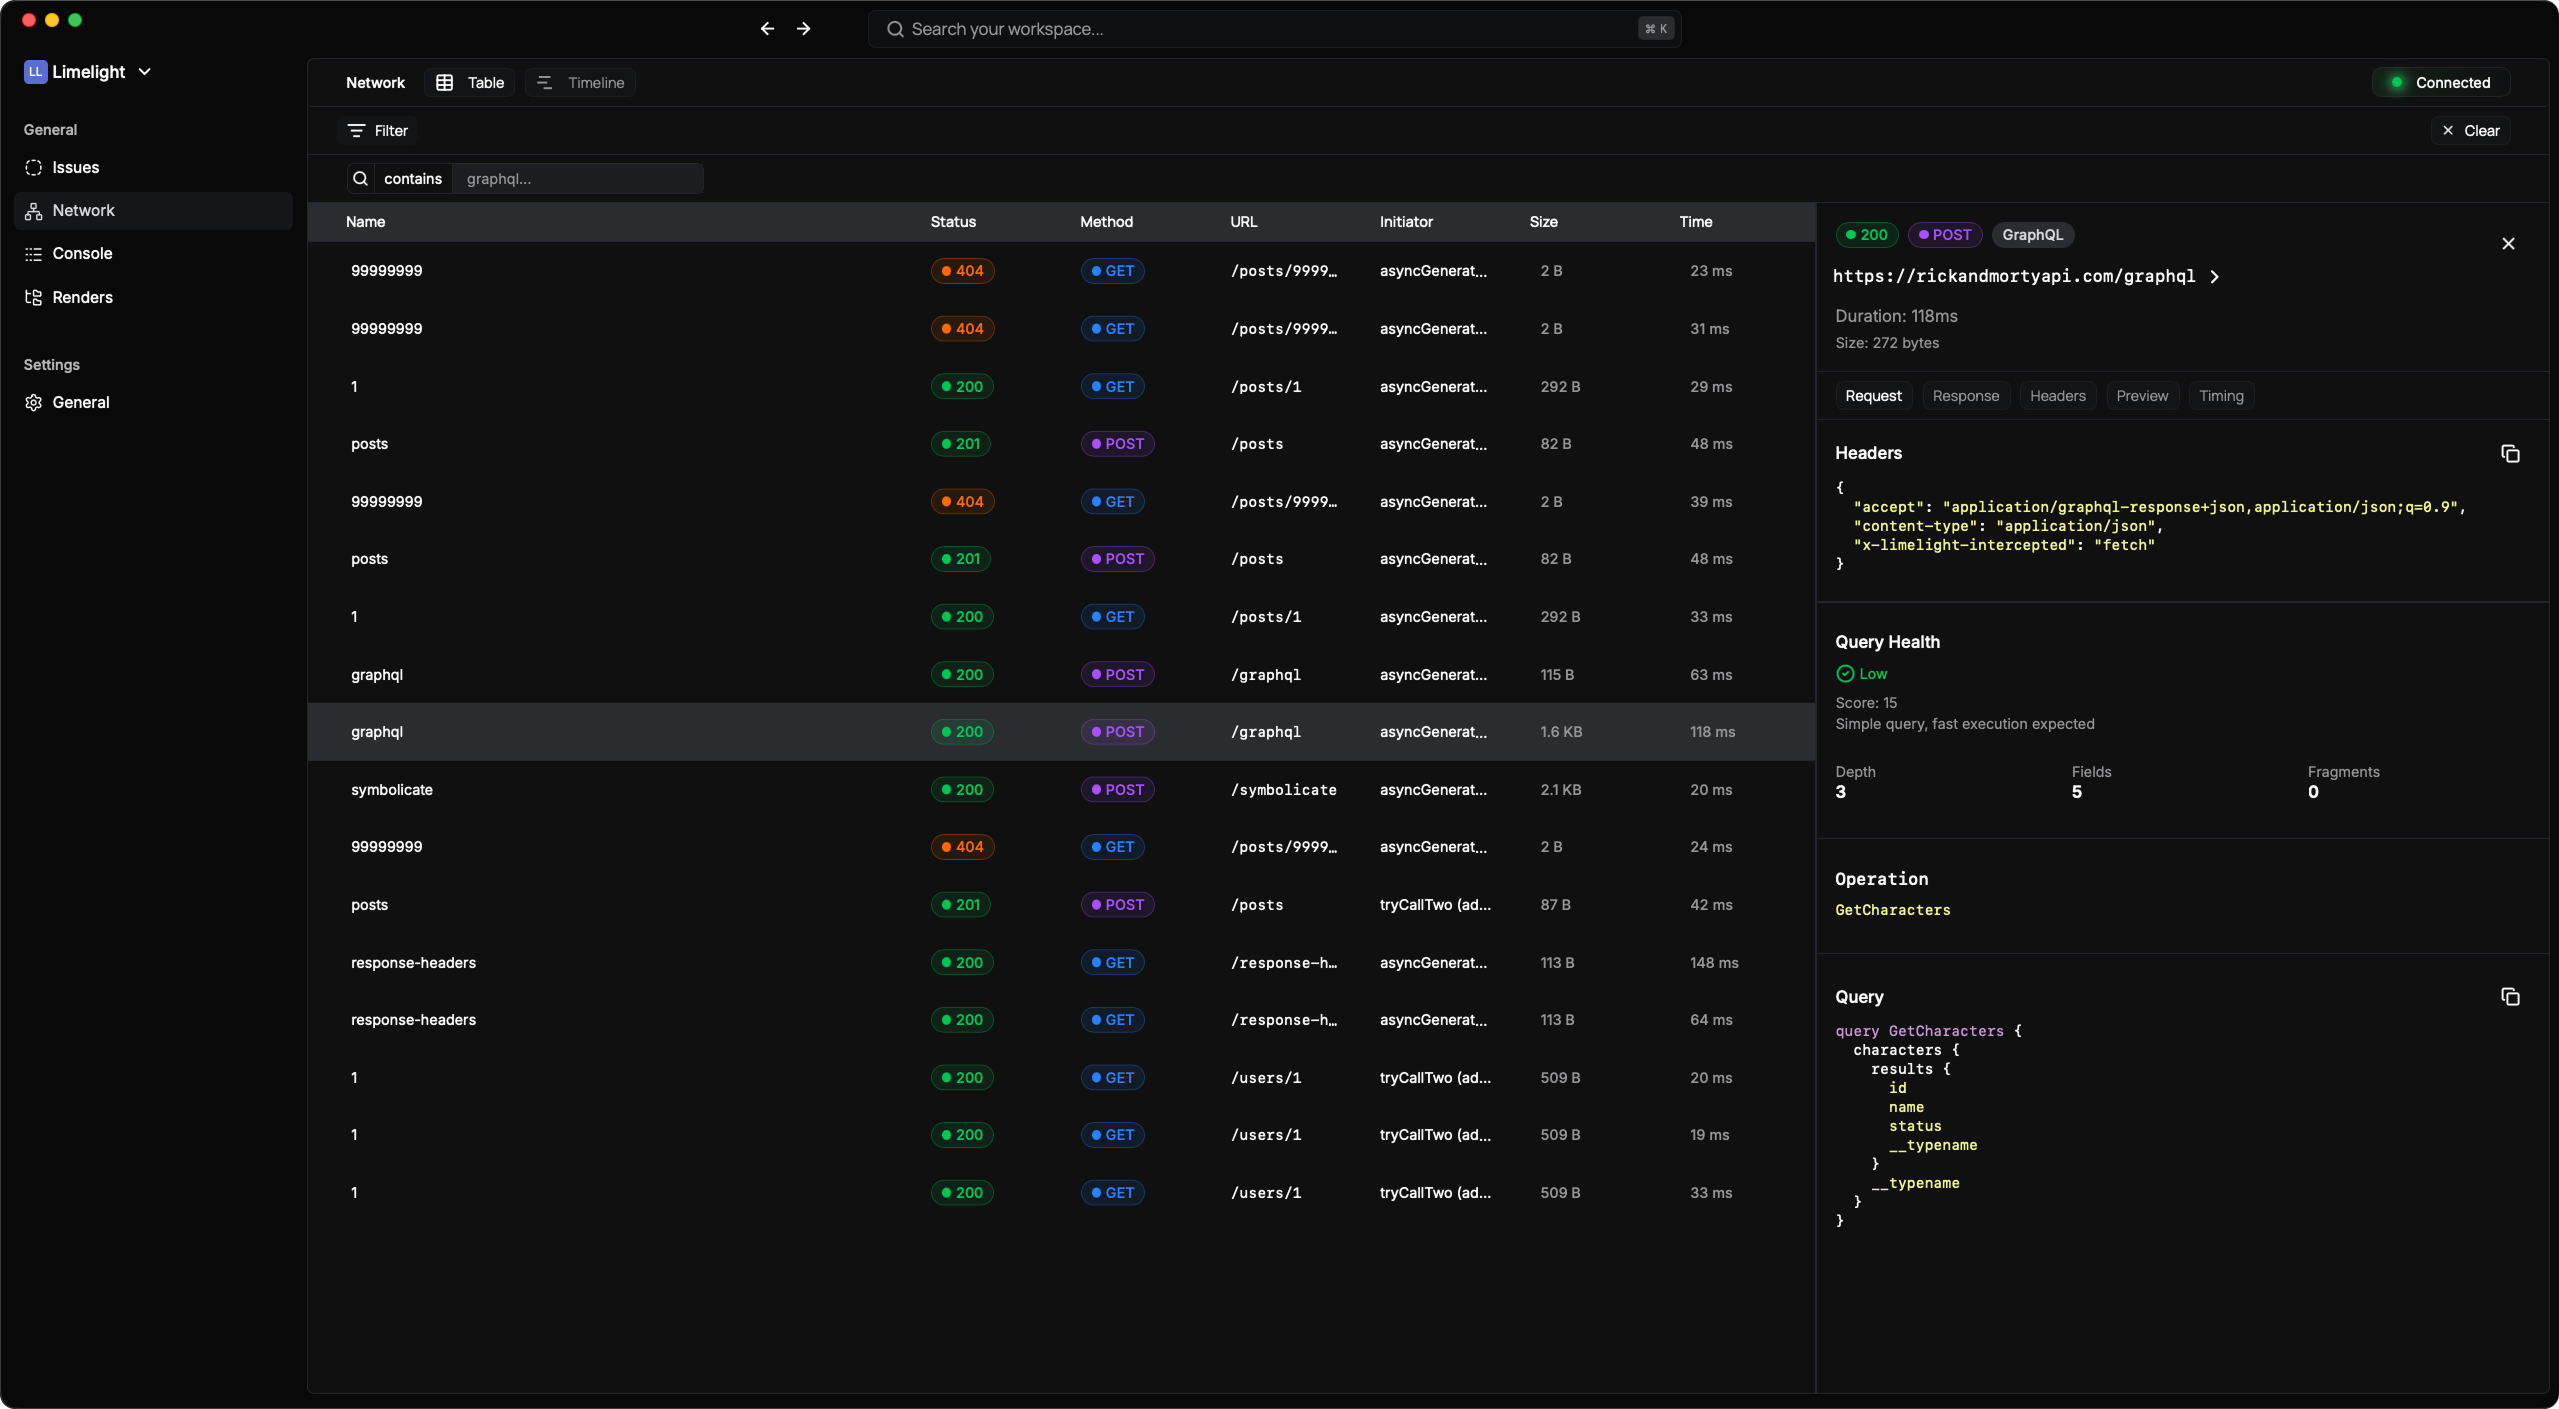
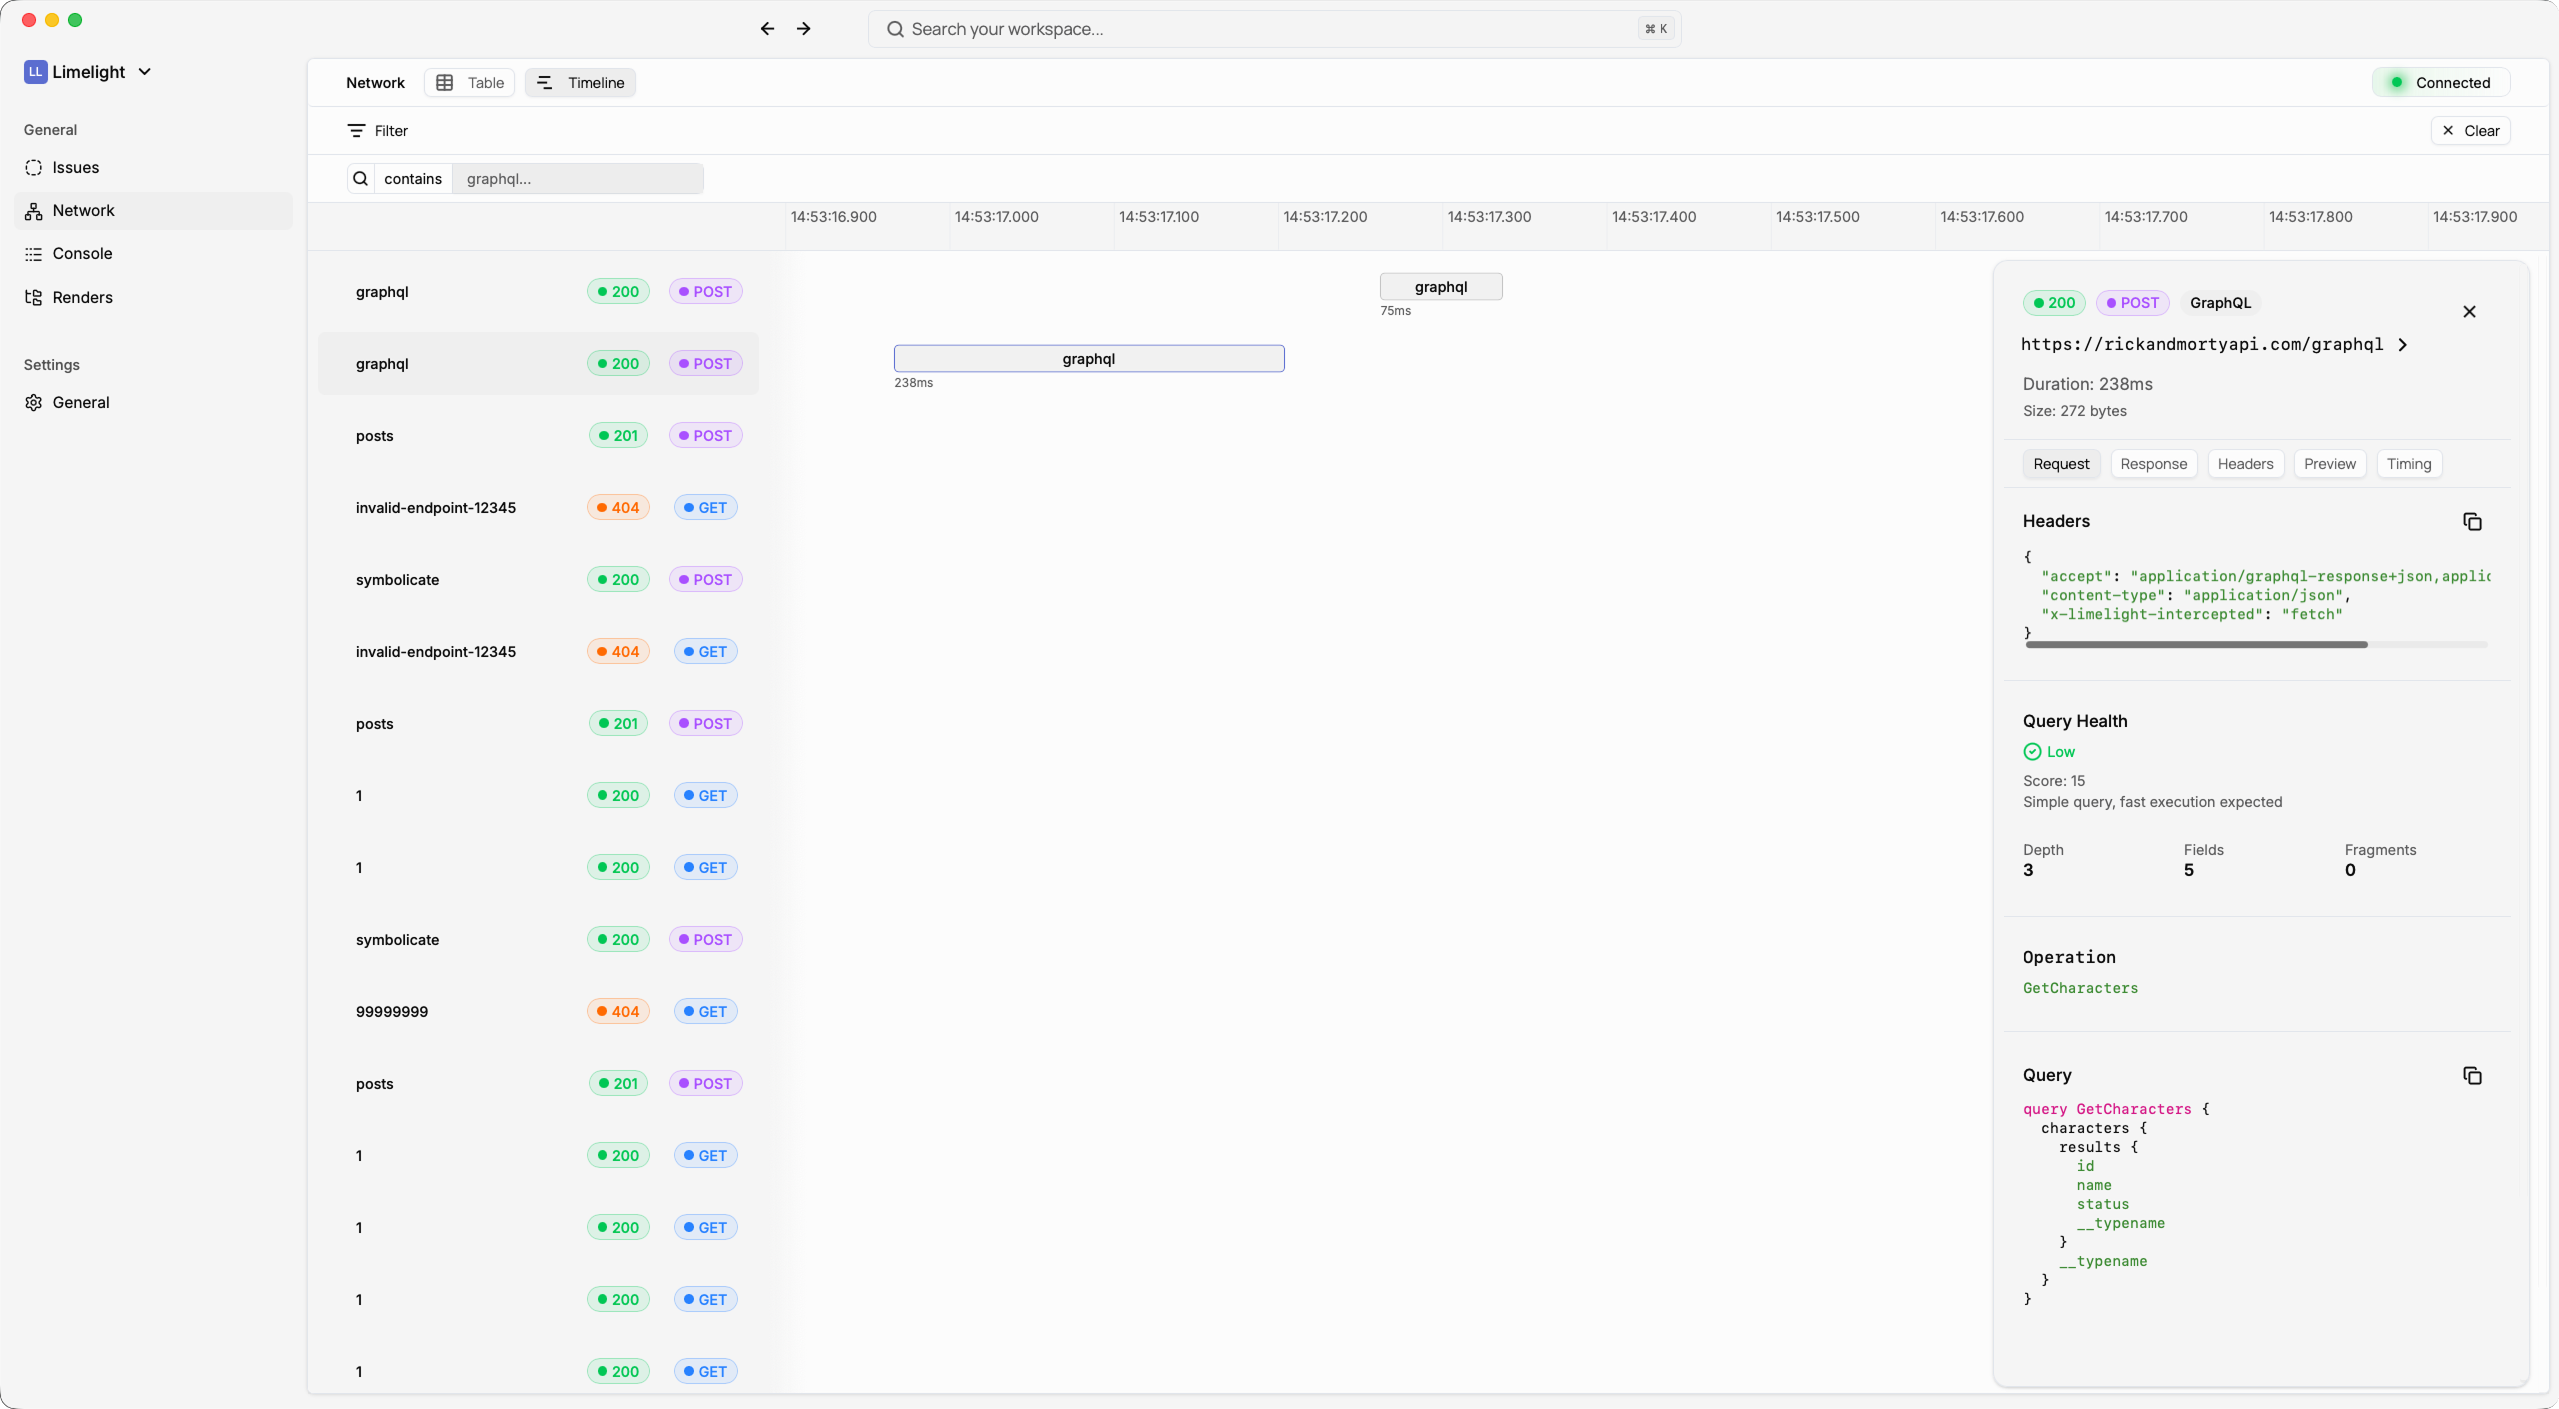
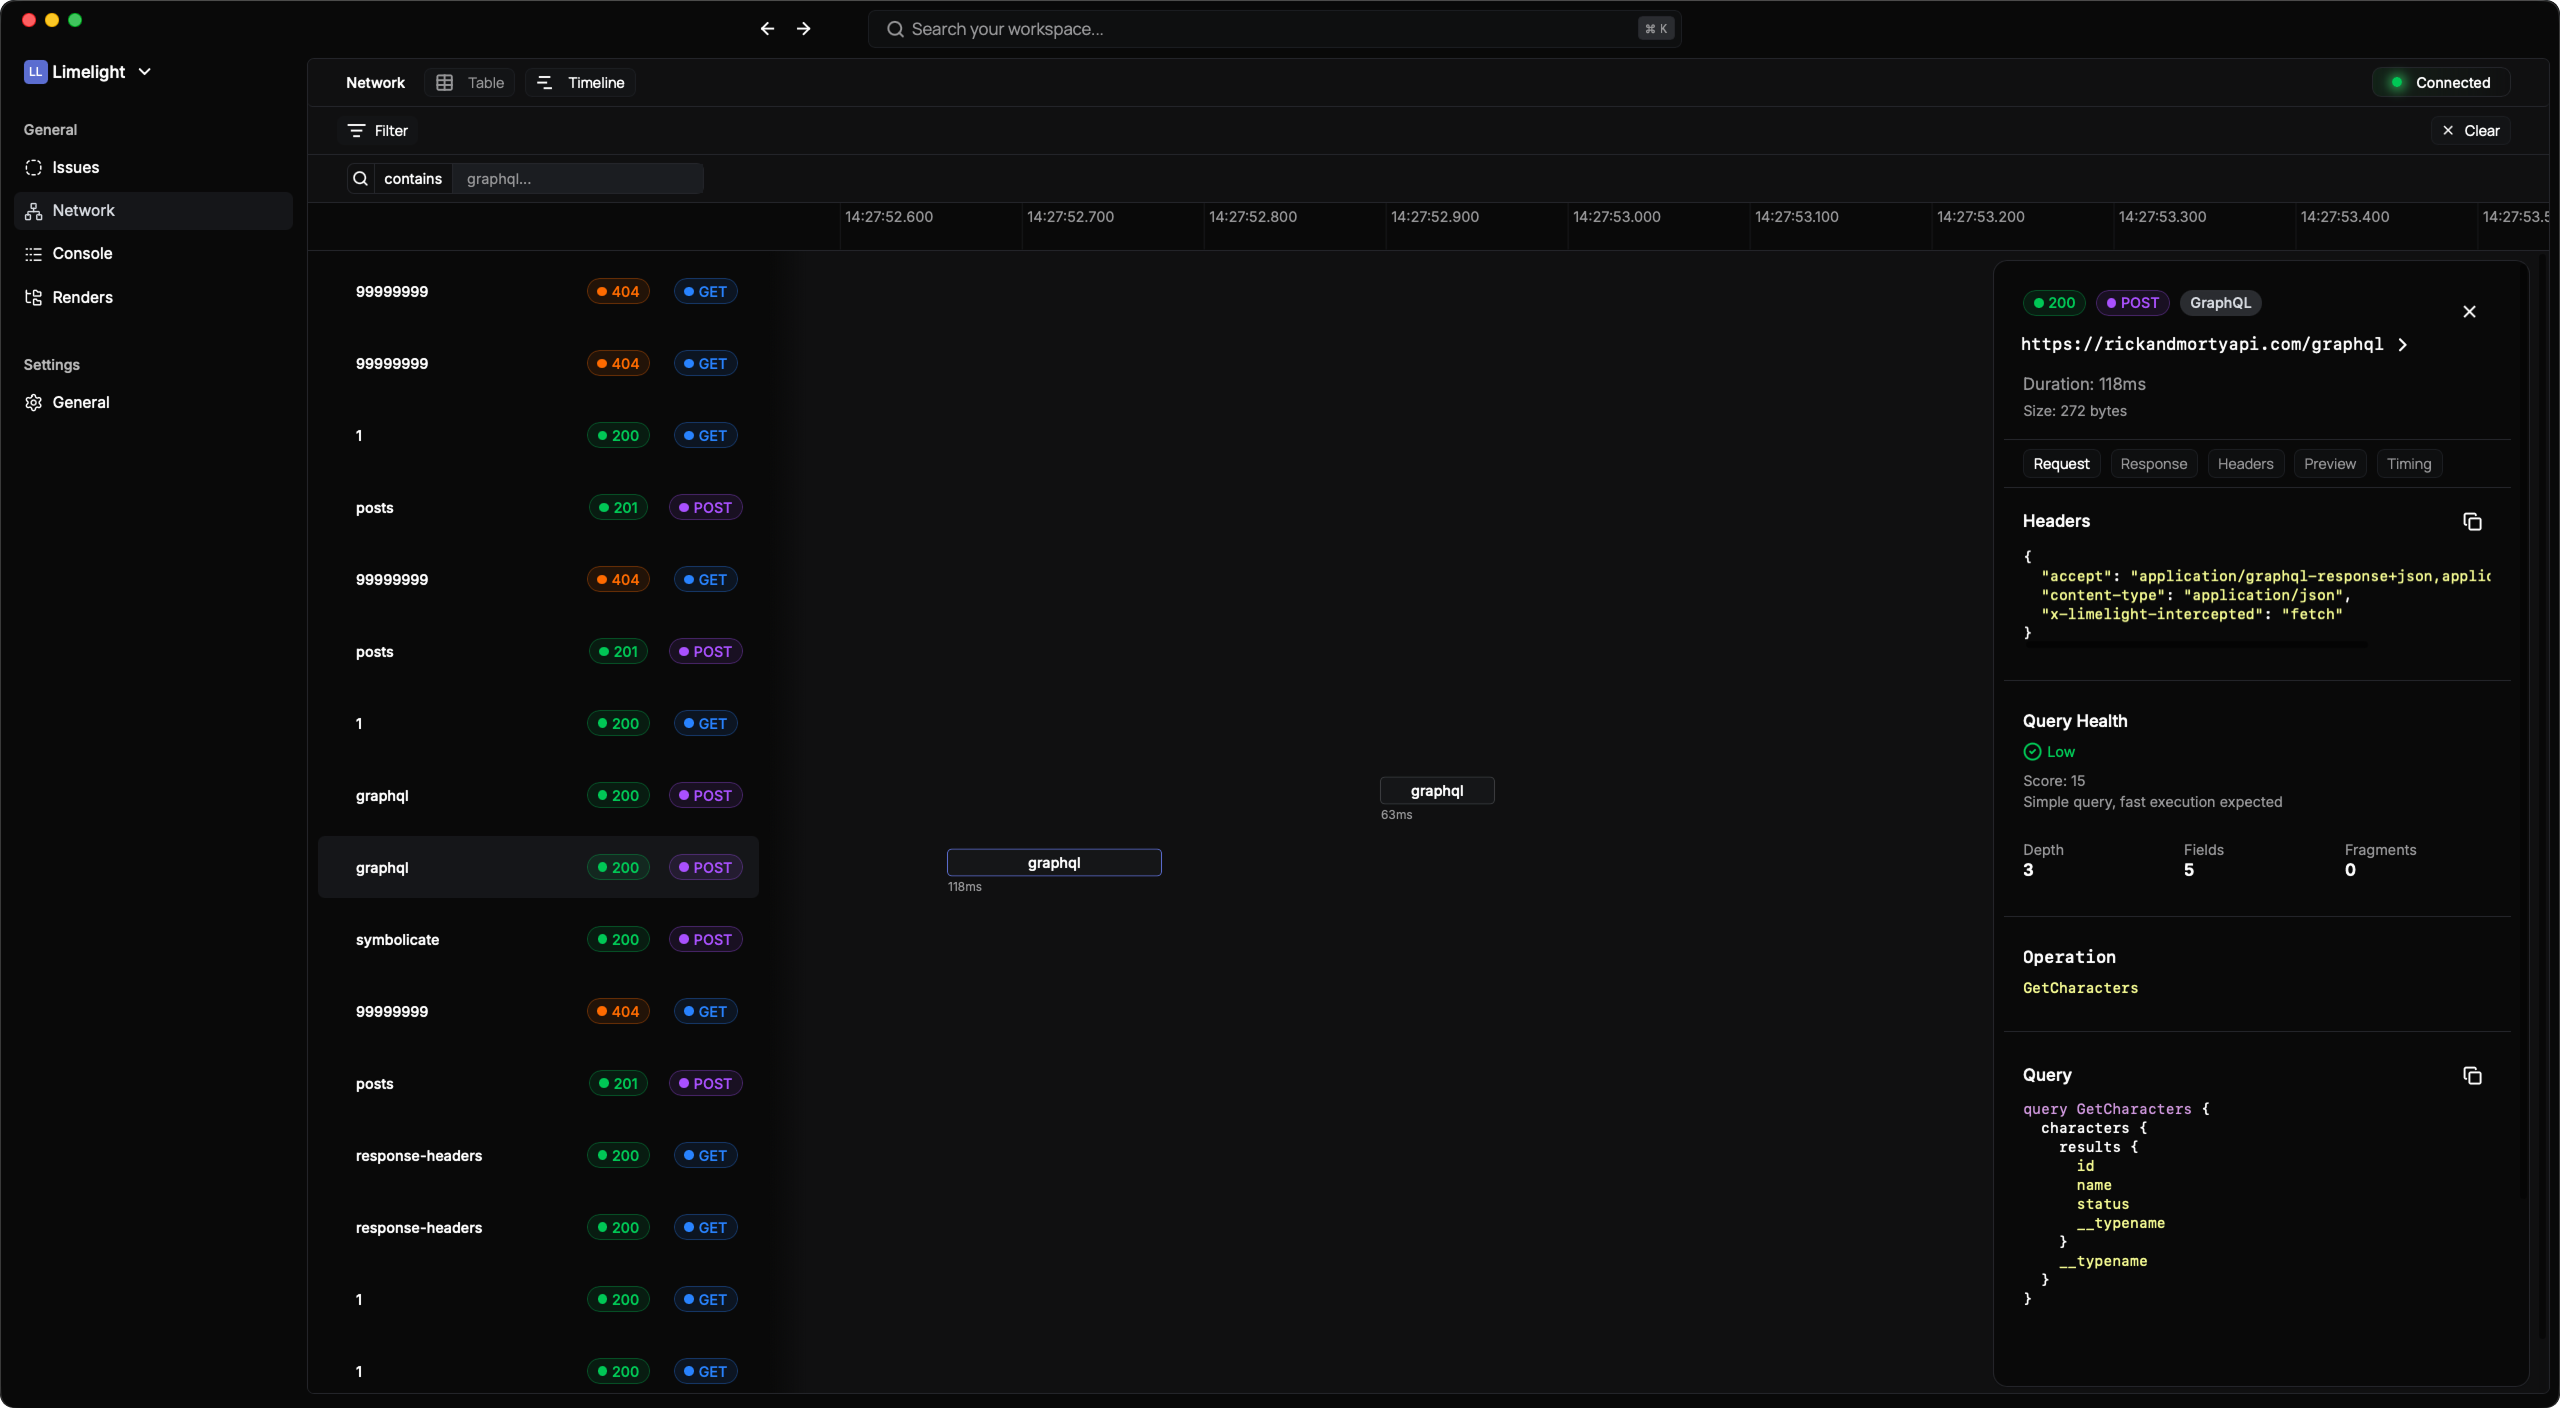
Get a complete view of every network request your app makes:
* **Interactive timeline** with zoom and pan controls
* **Real-time updates** as requests complete
* **Advanced filtering** by method, status, URL, or GraphQL operations
* **Request timing visualization** to spot slow endpoints instantly
 ### Deep Request Analysis
Click any request to see:
* Full request and response headers
* Request/response body with **interactive JSON viewer**
* Method, URL, status code, and timing metrics
* Request/response size tracking
* **Syntax highlighting** for different data types
### Interactive JSON Viewer
Navigate complex API responses effortlessly:
* **Expand/collapse** nested objects and arrays
* **Syntax highlighting** (strings, numbers, booleans, null)
* **Clickable URLs** automatically detected and linked
* **Copy functionality** at any level
* **Deep nesting support** with visual indentation
* **Light/dark mode** aware
### Deep Request Analysis
Click any request to see:
* Full request and response headers
* Request/response body with **interactive JSON viewer**
* Method, URL, status code, and timing metrics
* Request/response size tracking
* **Syntax highlighting** for different data types
### Interactive JSON Viewer
Navigate complex API responses effortlessly:
* **Expand/collapse** nested objects and arrays
* **Syntax highlighting** (strings, numbers, booleans, null)
* **Clickable URLs** automatically detected and linked
* **Copy functionality** at any level
* **Deep nesting support** with visual indentation
* **Light/dark mode** aware
 ***
## GraphQL-First Debugging
Limelight is the only React Native debugger built specifically for GraphQL. Here's what makes it special:
### Automatic GraphQL Detection
No configuration needed. Limelight automatically:
* **Detects GraphQL requests** from any client (Apollo, urql, Relay, plain fetch)
* **Extracts and parses** queries, mutations, and subscriptions
* **Works with any GraphQL server** and client library
### Query Complexity Analysis
Understand the performance impact of every GraphQL operation:
Real-time analysis based on query depth, field count, and fragment usage
**Severity Levels:**
| Score | Level | Indicator | What It Means |
| ------- | --------- | --------- | ------------------------------------------ |
| \< 50 | Low | 🟢 Green | Simple query, fast execution expected |
| 50-150 | Medium | 🟡 Yellow | Moderate complexity, watch for performance |
| 150-300 | High | 🟠 Orange | Complex query, may impact performance |
| 300+ | Very High | 🔴 Red | Very complex query, likely slow |
**Actionable Recommendations:**
Limelight automatically warns you about:
* **Deep nesting** (depth > 4 levels)
* **Large field counts** (> 100 fields selected)
* **Fragment overuse** (> 10 fragments in one query)
### Beautiful GraphQL Formatting
Every GraphQL request is formatted for easy reading:
**Operation Display:**
* Operation name prominently displayed
* Separated sections for query, variables, and response
* Individual **copy buttons** for each section
**Syntax Highlighting:**
* Full GraphQL syntax highlighting with color-coded:
* Keywords (`query`, `mutation`, `fragment`)
* Type names and field names
* Variables and directives
* String values, numbers, and booleans
* Preserves formatting with proper indentation
* Theme-aware (light/dark mode)
**Variables Viewer:**
* Interactive JSON display for variables
* Expand/collapse complex variable structures
* Separate copy functionality
### GraphQL Error Handling
When GraphQL errors occur, Limelight makes them crystal clear:
* **Extracts GraphQL errors** from response body
* **Beautiful error cards** showing:
* Error message prominence
* Field path where error occurred
* Line and column numbers
* Error codes and extensions
* **Multiple error support** with individual cards
* **Expandable details** for complex errors
***
***
## GraphQL-First Debugging
Limelight is the only React Native debugger built specifically for GraphQL. Here's what makes it special:
### Automatic GraphQL Detection
No configuration needed. Limelight automatically:
* **Detects GraphQL requests** from any client (Apollo, urql, Relay, plain fetch)
* **Extracts and parses** queries, mutations, and subscriptions
* **Works with any GraphQL server** and client library
### Query Complexity Analysis
Understand the performance impact of every GraphQL operation:
Real-time analysis based on query depth, field count, and fragment usage
**Severity Levels:**
| Score | Level | Indicator | What It Means |
| ------- | --------- | --------- | ------------------------------------------ |
| \< 50 | Low | 🟢 Green | Simple query, fast execution expected |
| 50-150 | Medium | 🟡 Yellow | Moderate complexity, watch for performance |
| 150-300 | High | 🟠 Orange | Complex query, may impact performance |
| 300+ | Very High | 🔴 Red | Very complex query, likely slow |
**Actionable Recommendations:**
Limelight automatically warns you about:
* **Deep nesting** (depth > 4 levels)
* **Large field counts** (> 100 fields selected)
* **Fragment overuse** (> 10 fragments in one query)
### Beautiful GraphQL Formatting
Every GraphQL request is formatted for easy reading:
**Operation Display:**
* Operation name prominently displayed
* Separated sections for query, variables, and response
* Individual **copy buttons** for each section
**Syntax Highlighting:**
* Full GraphQL syntax highlighting with color-coded:
* Keywords (`query`, `mutation`, `fragment`)
* Type names and field names
* Variables and directives
* String values, numbers, and booleans
* Preserves formatting with proper indentation
* Theme-aware (light/dark mode)
**Variables Viewer:**
* Interactive JSON display for variables
* Expand/collapse complex variable structures
* Separate copy functionality
### GraphQL Error Handling
When GraphQL errors occur, Limelight makes them crystal clear:
* **Extracts GraphQL errors** from response body
* **Beautiful error cards** showing:
* Error message prominence
* Field path where error occurred
* Line and column numbers
* Error codes and extensions
* **Multiple error support** with individual cards
* **Expandable details** for complex errors
***